Transform Data Into Actionable Insights
Comprehensive smart dashboard and data visualization solutions that turn your raw data into strategic assets for data-driven decision making.
Are You Making Decisions in the Dark?
Most businesses collect massive amounts of data but struggle to visualize it in ways that drive decisions. Spreadsheets and static reports are time-consuming and often miss the bigger picture.
Spreadsheet Overload
Too many spreadsheets with inconsistent data formats and no single source of truth
Time-Consuming Reports
Manual reporting processes delay critical insights when you need them most
Missed Insights
Inability to see trends, patterns, and opportunities hidden in your data
Our Dashboard & Visualization Services
End-to-end solutions designed to transform your data into strategic assets.
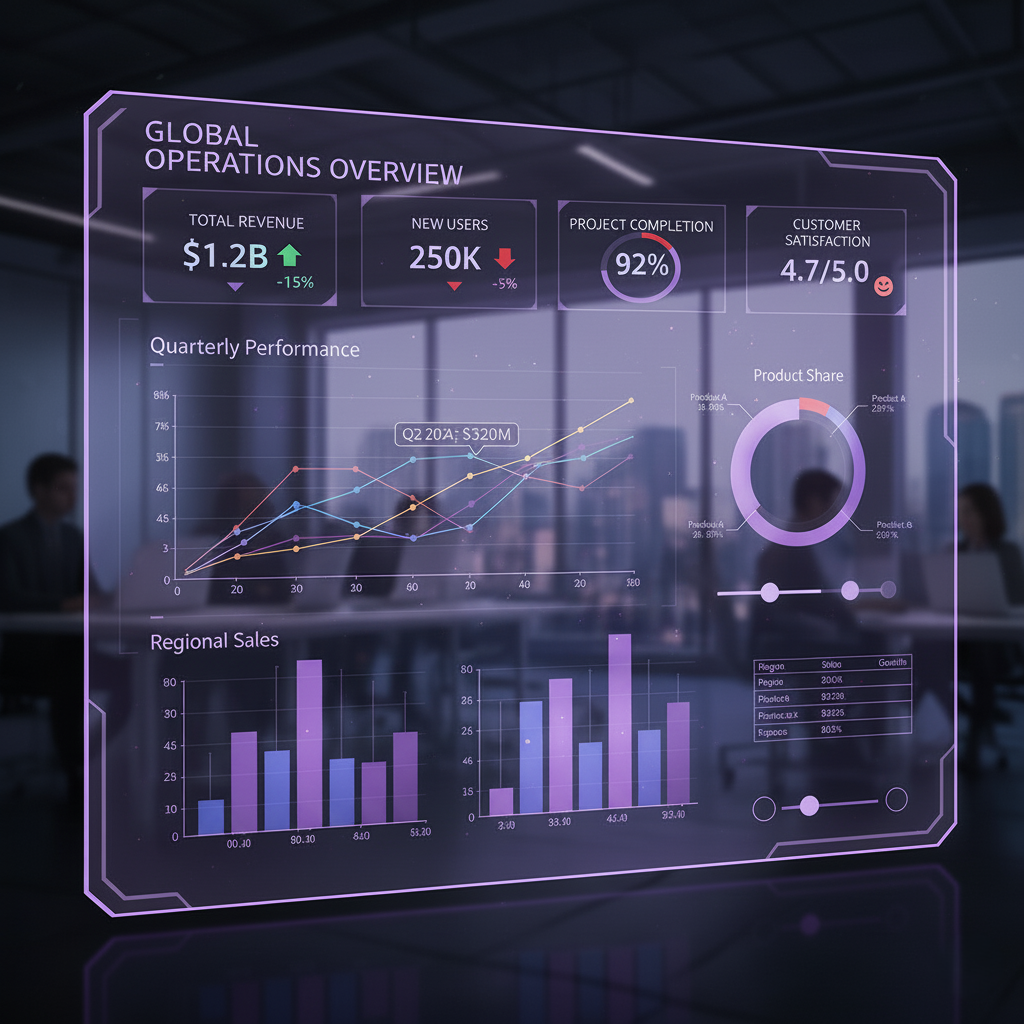
Smart Dashboards
Interactive, real-time data visualization
Data Visualization
Advanced charts, graphs, and reporting
Performance & Executive Analytics
Strategic insights for leadership
Consolidate data from multiple sources
Connect to databases, APIs, spreadsheets, and cloud services for a unified view of your business.
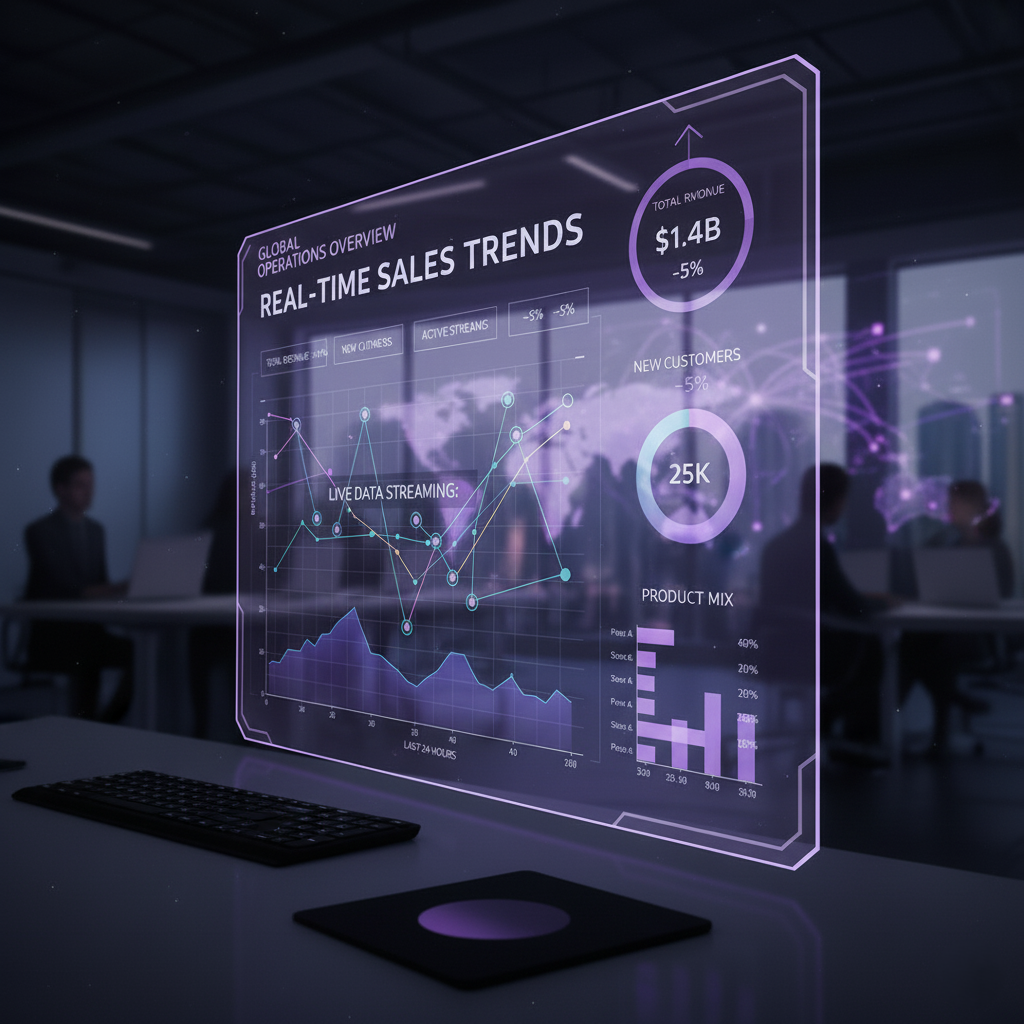
Real-time updates & automation
Get live data updates and automated reporting so you’re always working with the latest information.
Interactive filters & drill-down capabilities
Explore your data from different angles with intuitive filtering and detailed drill-down features.
Mobile-friendly design
Access your dashboards on any device with responsive designs that work perfectly on desktop, tablet, and mobile.
Advanced Charting & Graphs
Create compelling visualizations with interactive charts, graphs, and heat maps that tell your data story.
Geospatial Visualization
Map your data geographically to uncover regional patterns, distribution, and location-based insights.
Network & Relationship Mapping
Visualize complex relationships and connections within your data to understand interdependencies.
Custom Branding & Design
Tailored visual styles that align with your brand identity while ensuring optimal data readability.
Strategic KPI Tracking
Monitor key performance indicators that align with your business objectives and strategic goals.
Executive Scorecards
High-level performance summaries that provide quick insights into organizational health and progress.
Performance Benchmarking
Compare your performance against industry standards, competitors, and historical data.
Executive Decision Support
Data-driven insights and recommendations to support strategic decision-making at the leadership level.
Why Choose Our Dashboard & Visualization Solutions?
Save Time
Eliminate manual reporting and data consolidation with automated dashboards and visualizations.
Better Decisions
Visualize KPIs clearly to identify trends and make informed decisions faster with actionable insights.
Scalability
Solutions grow with your business, adapting to new data sources and evolving requirements.
Customization
Tailored layouts, metrics, and visualizations designed specifically for your business needs.
Our Technology Stack
We work with industry-leading BI and visualization tools to deliver the best solutions for your needs.
Dashboard & Visualization Success Stories
See how our solutions have transformed businesses across industries.
Global Retail Chain
RetailChallenge: Inability to track real-time sales performance across 250+ locations and optimize inventory management.
Solution: Implemented a comprehensive BI platform with real-time dashboards and predictive inventory management.
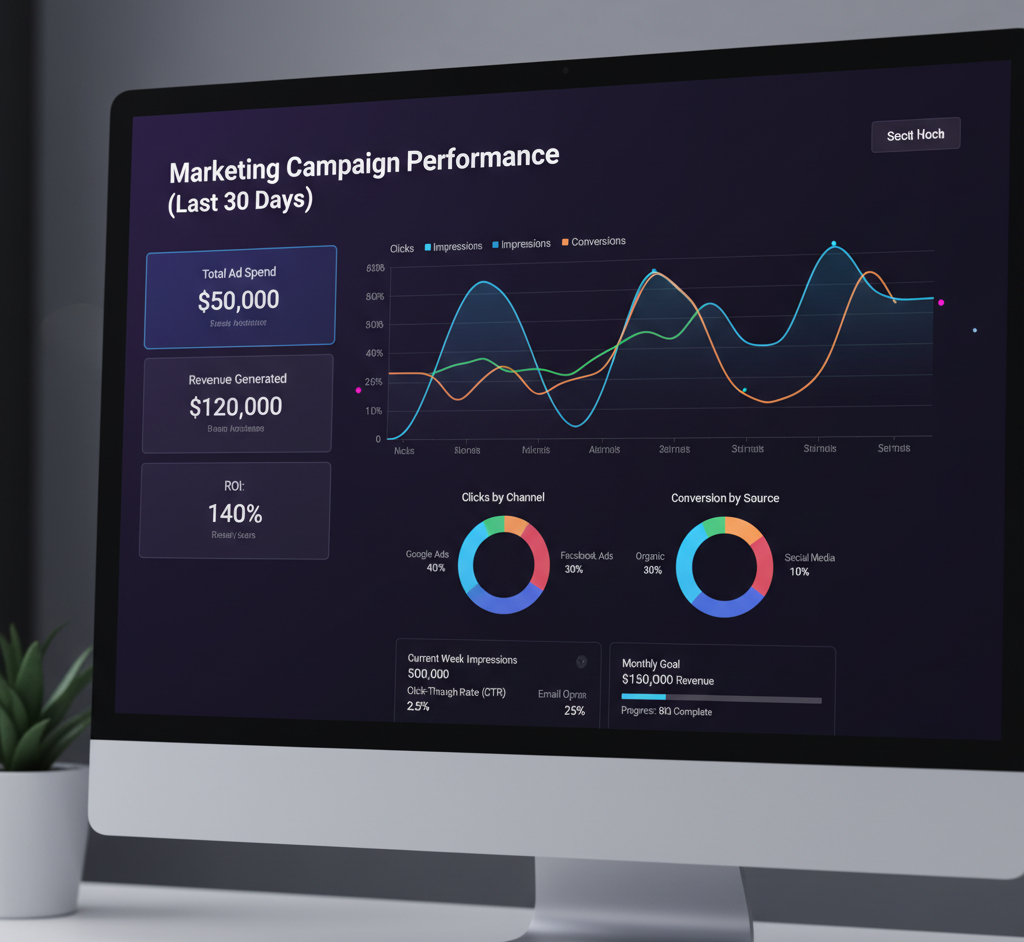
E-commerce Platform
E-commerceChallenge: Marketing team couldn’t track campaign ROI across multiple channels and optimize ad spend.
Solution: Developed a unified marketing dashboard with multi-channel attribution and customer journey mapping.
Financial Services Provider
FinanceManual reporting processes and lack of unified view of client portfolios and risk exposure.

Manufacturing Company
ManufacturingInefficient production tracking and inability to identify bottlenecks in real-time.

Healthcare Network
HealthcareFragmented patient data and inability to track treatment outcomes across facilities.
Our Dashboard Development Process
Discovery & Strategy
We conduct in-depth analysis of your business objectives, data landscape, and define measurable KPIs for success.
Data Architecture & Integration
Design and implement robust data pipelines, warehousing solutions, and integration frameworks.
Dashboard Design & Build
Our experts design and develop your custom dashboard with iterative feedback to ensure it meets your needs.
Deployment & Training
We deploy your dashboard, provide comprehensive training, and offer ongoing support and updates.
Ongoing Optimization
Continuous monitoring, performance optimization, and strategic enhancements to drive maximum value.
What Our Clients Say
Jane Doe
CEO, Tech Innovators
“The sales dashboard Datlumen created for us has transformed how we make decisions. We now have real-time visibility into our performance metrics and can spot trends as they happen. The ROI was evident within the first quarter.”
John Smith
Operations Director, Global Retail
“Working with Datlumen on our supply chain visualization project was a game-changer. They understood our complex data requirements and delivered an intuitive dashboard that our entire team can use. The support has been exceptional throughout.”
Frequently Asked Questions
How long does it take to develop a custom dashboard?
The timeline depends on the complexity of your requirements and data sources. Simple dashboards can be delivered in 2-4 weeks, while more complex solutions with multiple data integrations may take 6-8 weeks. We provide a detailed timeline after our initial discovery session.
Do you provide training and ongoing support?
Yes, we provide comprehensive training for your team to ensure you can effectively use and maintain your dashboards. We also offer ongoing support packages that include regular updates, performance monitoring, and enhancements as your business needs evolve.
Can you integrate with our existing systems?
Absolutely. We have experience integrating with a wide range of systems including CRMs, ERPs, marketing platforms, databases, and cloud services. During our discovery phase, we’ll assess your current tech stack and design a solution that works seamlessly with your existing infrastructure.
What’s the difference between a dashboard and data visualization?
A dashboard is an interactive interface that consolidates and displays key metrics and visualizations in one place for monitoring performance. Data visualization refers to the graphical representation of data through charts, graphs, and other visual elements. Dashboards typically contain multiple visualizations that work together to provide a comprehensive view of business performance.
How do you ensure data security?
Data security is our top priority. We implement industry-standard security measures including encryption, secure authentication, role-based access controls, and regular security audits. We comply with relevant data protection regulations and can work with your security team to meet specific compliance requirements.
Ready to Transform Your Data into Actionable Insights?
Schedule a free consultation and demo to see how our dashboard and visualization solutions can drive your business forward.
Or email us at: info@datlumen.com